CVSヘルス株式会社
| Security | CVS / CVS Health Corporation |
| Insider | Tilak Mandadi |
This page shows the track record and history of Mandadi Tilak
insider trades in CVS Health Corporation. The SEC defines Insiders as officers, directors, or significant investors (greater than 10% ownership) in a company.
It is illegal for insiders to make trades in their companies based on material, non-public information ("MNPI"). This does not mean
it is illegal for them to make any
trades in their own companies. However, they must report all trades to the SEC via a Form 4.
Insider Purchases - Short Term Profit Analysis
In this section, we analyze the profitability of every unplanned, open-market insider purchase made by Tilak Mandadi in CVS / CVS Health Corporation. This analysis helps to understand if the insider consistently generates abnormal returns, and is worth following. This analysis is for one-year following each trade, and the results are theoretical.
The following table shows the most recent open market purchases that were not part of an automatic trading plan.
| Trade Date | Reported Shares |
Reported Price |
Adjusted Shares |
Adjusted Price |
Cost Basis | Days to Max |
Price at Max |
Max Profit ($) |
Max Return (%) |
|---|---|---|---|---|---|---|---|
| There are no known unplanned open-market trades for this insider |
Adjusted Price is the split-adjusted price. Adjusted Shares is the split-adjusted shares.
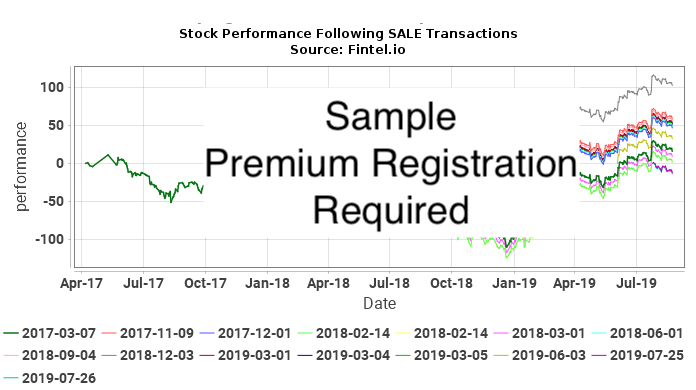
Insider Sales - Short Term Loss Analysis
In this section, we analyze the short-term loss avoidance of every unplanned, open-market insider sale made by Tilak Mandadi in CVS / CVS Health Corporation. A consistent pattern of loss avoidance may suggest that future sale transactions may predict declines in price. This analysis is for one-year following each trade, and the results are theoretical.
The following table shows the most recent open market purchases that were not part of an automatic trading plan.
| Trade Date | Reported Shares |
Reported Price |
Adjusted Shares |
Adjusted Price |
Cost Basis | Days to Min |
Price at Min |
Max Loss Avoided ($) |
Max Loss Avoided (%) |
|---|---|---|---|---|---|---|---|---|---|
| 2026-05-08 | 69,551 | 89.5800 | 69,551 | 89.5800 | 6,230,379 | 25 | 89.5000 | -5,564 | -0.09 |
Adjusted Price is the split-adjusted price. Adjusted Shares is the split-adjusted shares.
Insider Transaction History
| File Date |
Trade Date |
Form | Insider | Ticker | Security Title | Code | Direct | Exercise Price |
Unit Price |
Units Changed |
Value Changed (1K) |
Remaining Options |
Remaining Shares |
|
|---|---|---|---|---|---|---|---|---|---|---|---|---|---|---|
| 2026-05-11 | 2026-05-08 | 4 | Mandadi Tilak | CVS | Common Stock | D | 89.5800 | -69,551 | -6,230 | 10,133 | ||||
| 2026-04-02 | 2026-04-01 | 4 | Mandadi Tilak | CVS | Common Stock | D | 72.4900 | -3,634 | -263 | 79,684 | ||||
| 2026-04-02 | 2026-03-31 | 4 | Mandadi Tilak | CVS | Common Stock (RSUs) | D | 71.8200 | 22,277 | 1,600 | 88,543 | ||||
| 2025-12-02 | 2025-11-30 | 4 | Mandadi Tilak | CVS | Common Stock | D | 80.3600 | -6,575 | -528 | 74,085 | ||||
| 2025-09-02 | 2025-08-31 | 4 | Mandadi Tilak | CVS | Common Stock | D | 73.1500 | -12,834 | -939 | 63,952 | ||||
| 2025-04-03 | 2025-04-01 | 4 | Mandadi Tilak | CVS | Common Stock (RSU) | D | 67.9800 | 20,594 | 1,400 | 116,257 | ||||
| 2025-04-03 | 2025-04-01 | 4 | Mandadi Tilak | CVS | Common Stock | D | 67.9800 | -995 | -68 | 43,503 | ||||
| 2024-12-03 | 2024-11-30 | 4 | Mandadi Tilak | CVS | Common Stock (RSU) | D | 59.8500 | 50,125 | 3,000 | 99,747 | ||||
| 2024-09-03 | 2024-08-31 | 4 | Mandadi Tilak | CVS | Common Stock | D | 57.2400 | -13,097 | -750 | 40,414 | ||||
| 2024-04-03 | 2024-04-01 | 4 | Mandadi Tilak | CVS | Common Stock (RSU) | D | 16,339 | 82,904 | ||||||
| 2023-09-01 | 2023-08-31 | 4 | Mandadi Tilak | CVS | Common Stock | D | 65.1700 | -13,053 | -851 | 20,229 | ||||
| 2022-09-02 | 2022-08-31 | 4 | Mandadi Tilak | CVS | Common Stock (RSU) | D | 99,847 | 99,847 |
P
非デリバティブまたはデリバティブ証券の公開市場または非公開購入
S
非デリバティブ証券またはデリバティブ証券の公開市場または非公開売却
A
会社からの有価証券の交付、授与その他の取得 (オプション等)
C
デリバティブの転換
D
有価証券の会社への売却または譲渡
F
会社から受領した有価証券の一部を使用した、行使価格または納税義務のお支払い
G
内部者によるまたは内部者に対する有価証券の贈与
K
株式スワップと類似のヘッジ取引
M
会社から受け取ったデリバティブ証券 (オプションなど) の行使または転換
V
フォーム4により任意に報告した取引
J
その他 (取引を説明する脚注を含む)